
Verified
Exit readiness score 13 out of 10011M
AED · Asking price
Tech-Enabled Dubai Freight & Logistics Platform — 900+ Clients
Dubai, United Arab Emirates
- Revenue
- AED 6.5M
- Profit
- AED 927K
- Multiple
- 11.9x



Exit readiness
0 of 100
Exit readiness. How much of the paperwork buyers ask for in diligence is already in this listing’s data room.
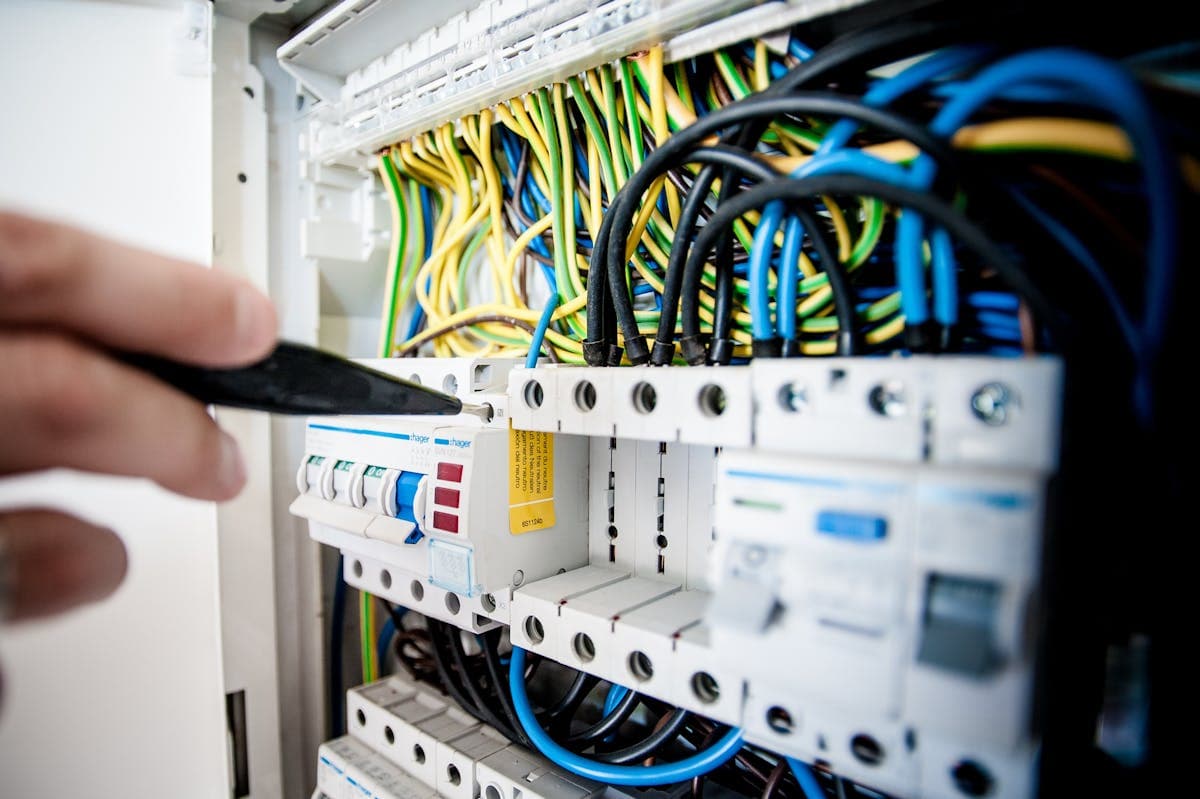
Illustrative image. This photo may be AI-generated and may not show the actual business or its assets.
Sign up free to contact the seller
A leading international designer, manufacturer, and supplier of freight railcar equipment and services, with operations spanning four continents. The business operates an integrated model combining railcar manufacturing, leasing of a ~17,000-unit fleet, maintenance services, and fleet management for Class I railroads and shippers across North America, Europe, and Brazil.
The business operates through three integrated segments:
Manufacturing: Designs and builds virtually all freight railcar types — including boxcars, covered hoppers, tank cars, intermodal flatcars, gondolas, auto racks, and proprietary automobile carriers. Manufacturing facilities span five plants across North America (US and Mexico) and six plants in Europe (Poland, Romania) plus operations in Brazil and Turkey. Annual production capacity of approximately 22,000 railcars.
Leasing: Owns and operates a lease fleet of approximately 17,000 railcars, primarily originating from the company's own manufacturing operations. Revenue is generated through long-term lease contracts with Class I railroads, shippers, and leasing companies.
Services: Provides railcar wheel services, parts, maintenance and retrofitting through a network of repair centers across North America. Also offers railcar management, regulatory compliance services, and fleet management for third-party railcar owners managing approximately 438,000 railcars.
Primary customers include all major Class I railroads, short-line railroads, shippers (agriculture, energy, chemicals, automotive, construction), and leasing companies across North America and Europe. The business benefits from a highly diversified customer base with no single customer representing disproportionate revenue concentration. The North American freight railcar market is underpinned by long-term demand drivers including replacement cycles for aging fleet, energy transport needs, and intermodal growth. European operations serve growing demand for sustainable freight transport. The lease fleet provides stable recurring revenue through multi-year contracts with creditworthy counterparties.
The business employs approximately 15,400 people across global operations. Leadership is headed by an experienced CEO and a seasoned C-suite with deep transportation industry expertise. Operations span four continents with manufacturing plants in the US (Arkansas), Mexico, Poland, Romania, Brazil, and Turkey, plus a corporate headquarters in Oregon. The integrated model — combining manufacturing, leasing, and services under one roof — creates operational efficiencies and cross-selling opportunities. Key operational strengths include vertical integration (in-house wheel services and component parts), a global footprint enabling regional demand responsiveness, and an asset-light services model that generates recurring revenue.
Near-term: Expansion of the lease fleet to meet growing demand for leased railcars; leveraging the integrated model to cross-sell maintenance and management services to manufacturing customers; new product launches including advanced railcar designs with enhanced safety and efficiency features.
Medium-term: Continued European expansion through the Romanian and Polish operations; penetration of emerging markets in the Middle East and South America; strategic bolt-on acquisitions to add manufacturing capacity and service capabilities.
Long-term: Transition toward more sustainable railcar solutions (lightweight materials, energy-efficient designs); growth in managed railcar fleet (currently ~438,000 cars) as railroads outsource fleet management; increasing recurring revenue share from leasing and services as a proportion of total revenue.
What the seller filed for each closed financial year, plus a trend for next year worked out from those years. The full accounts and the line-by-line detail sit behind an enquiry.
| Financial year | Revenue | EBITDA |
|---|---|---|
| FY2022 | $2,977,700,000 | $292,000,000 |
| FY2023 | $3,944,000,000 | $340,300,000 |
| FY2024 | $3,544,700,000 | $451,100,000 |
| FY2025 | $3,240,200,000 | $439,100,000 |
| FY2026 (trend) | $3,523,700,000 | $518,650,000 |
SellAnyBiz works this trend out from the 4 closed financial years above: a straight-line (least-squares) trend through them, extended one year, the same way for every listing. It is not a figure the seller gave.
The seller's own method comes first. The other tabs read the same figures a different way — only methods the seller's figures can actually answer are shown.
EBITDA multiple
$1,492,940,000
EBITDA $439.1M × 3.40
Similar deals buyers are exploring right now.
11M
AED · Asking price
Dubai, United Arab Emirates
600M
GBP · Asking price
Birmingham, United Kingdom

1.9M
USD · Asking price
North Pole, United States

7.5M
USD · Asking price
Orlando, United States

4M
EUR · Asking price
Romano d'Ezzelino, Italy

748M
USD · Asking price
New York, United States

2.2M
EUR · Asking price
MILANO, Italy

7.9M
EUR · Asking price
Savona, Italy
Asking price
$1.5BUSD
Sign up free to contact the seller